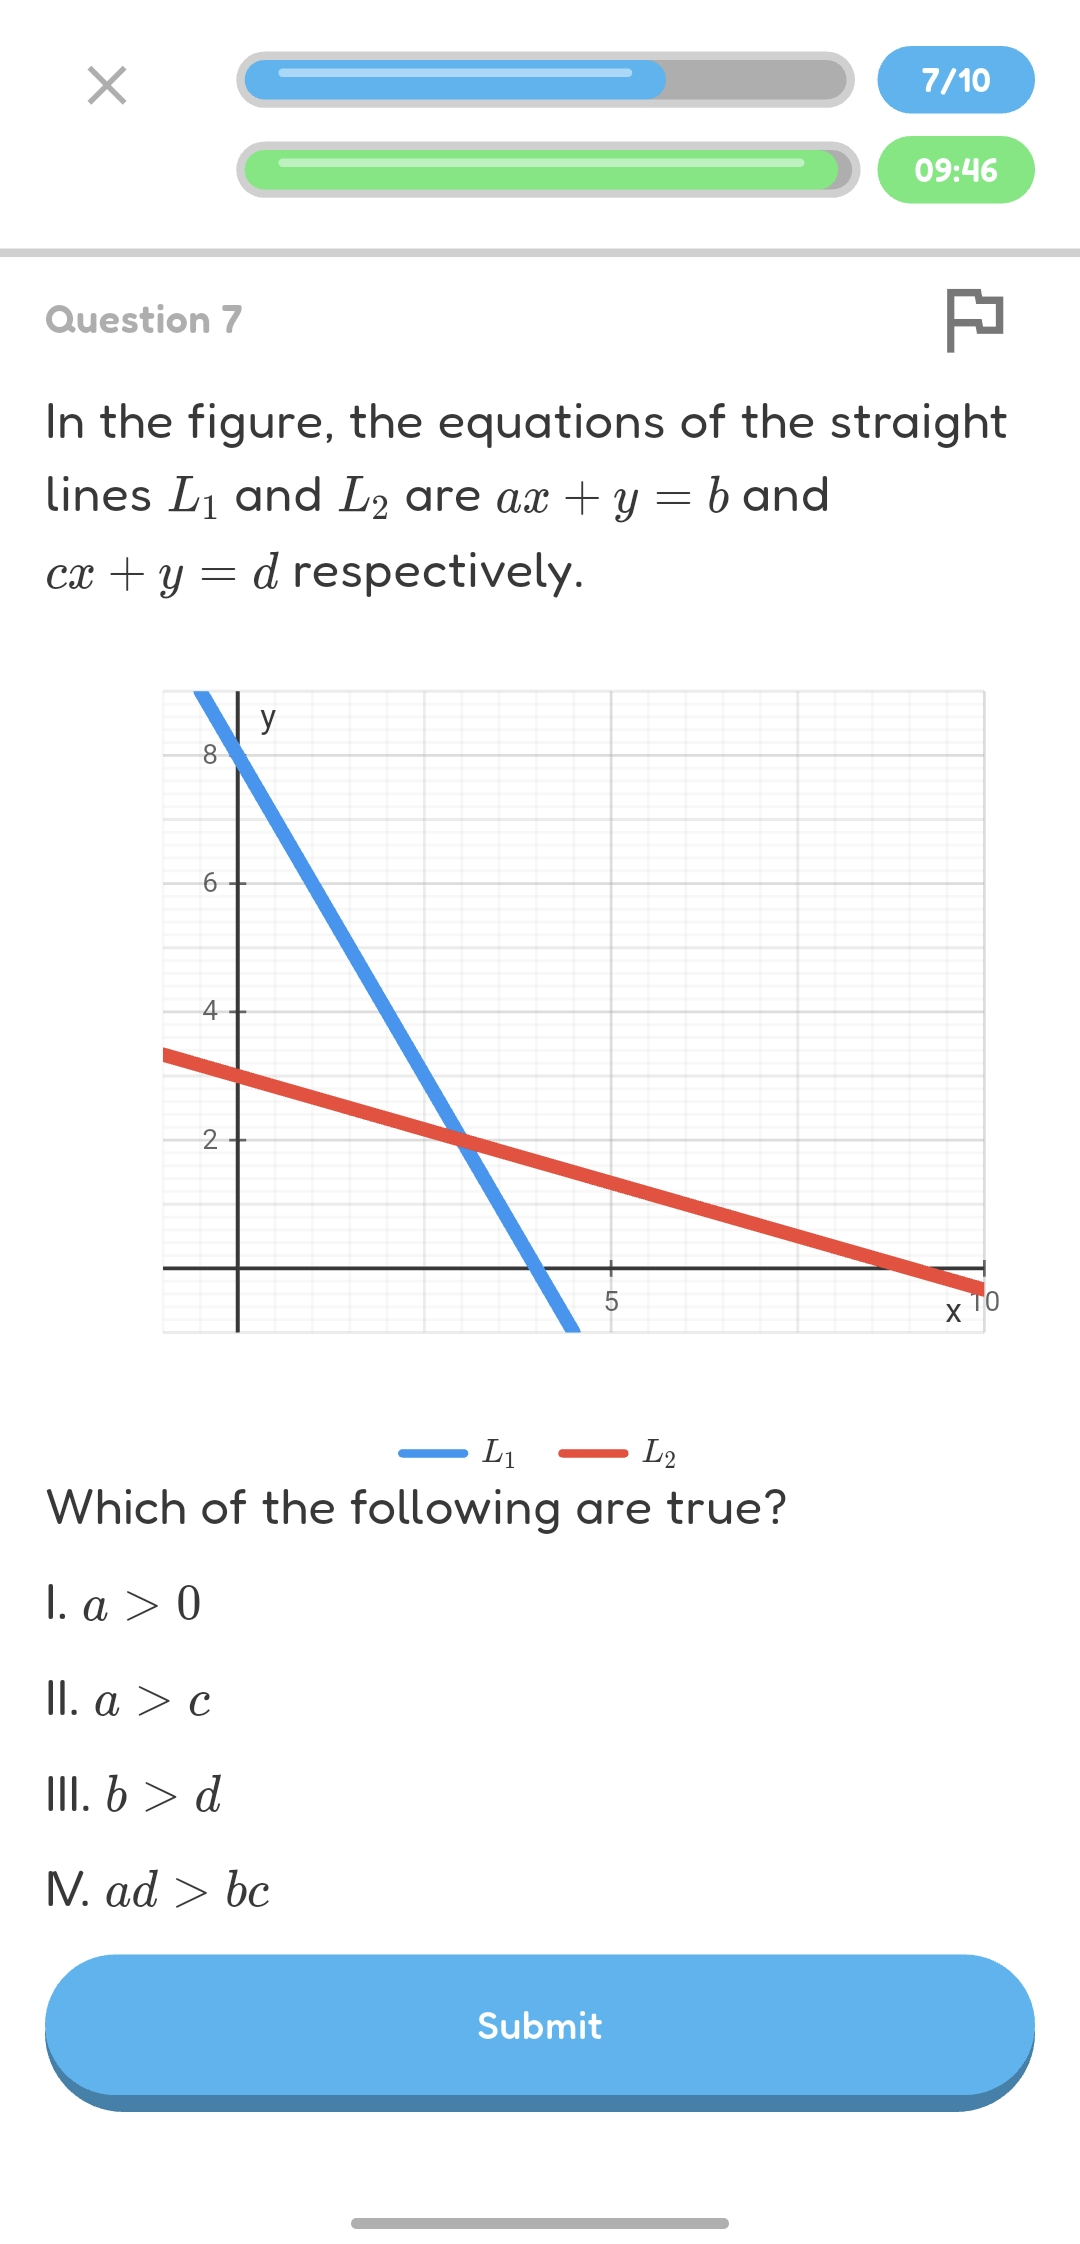
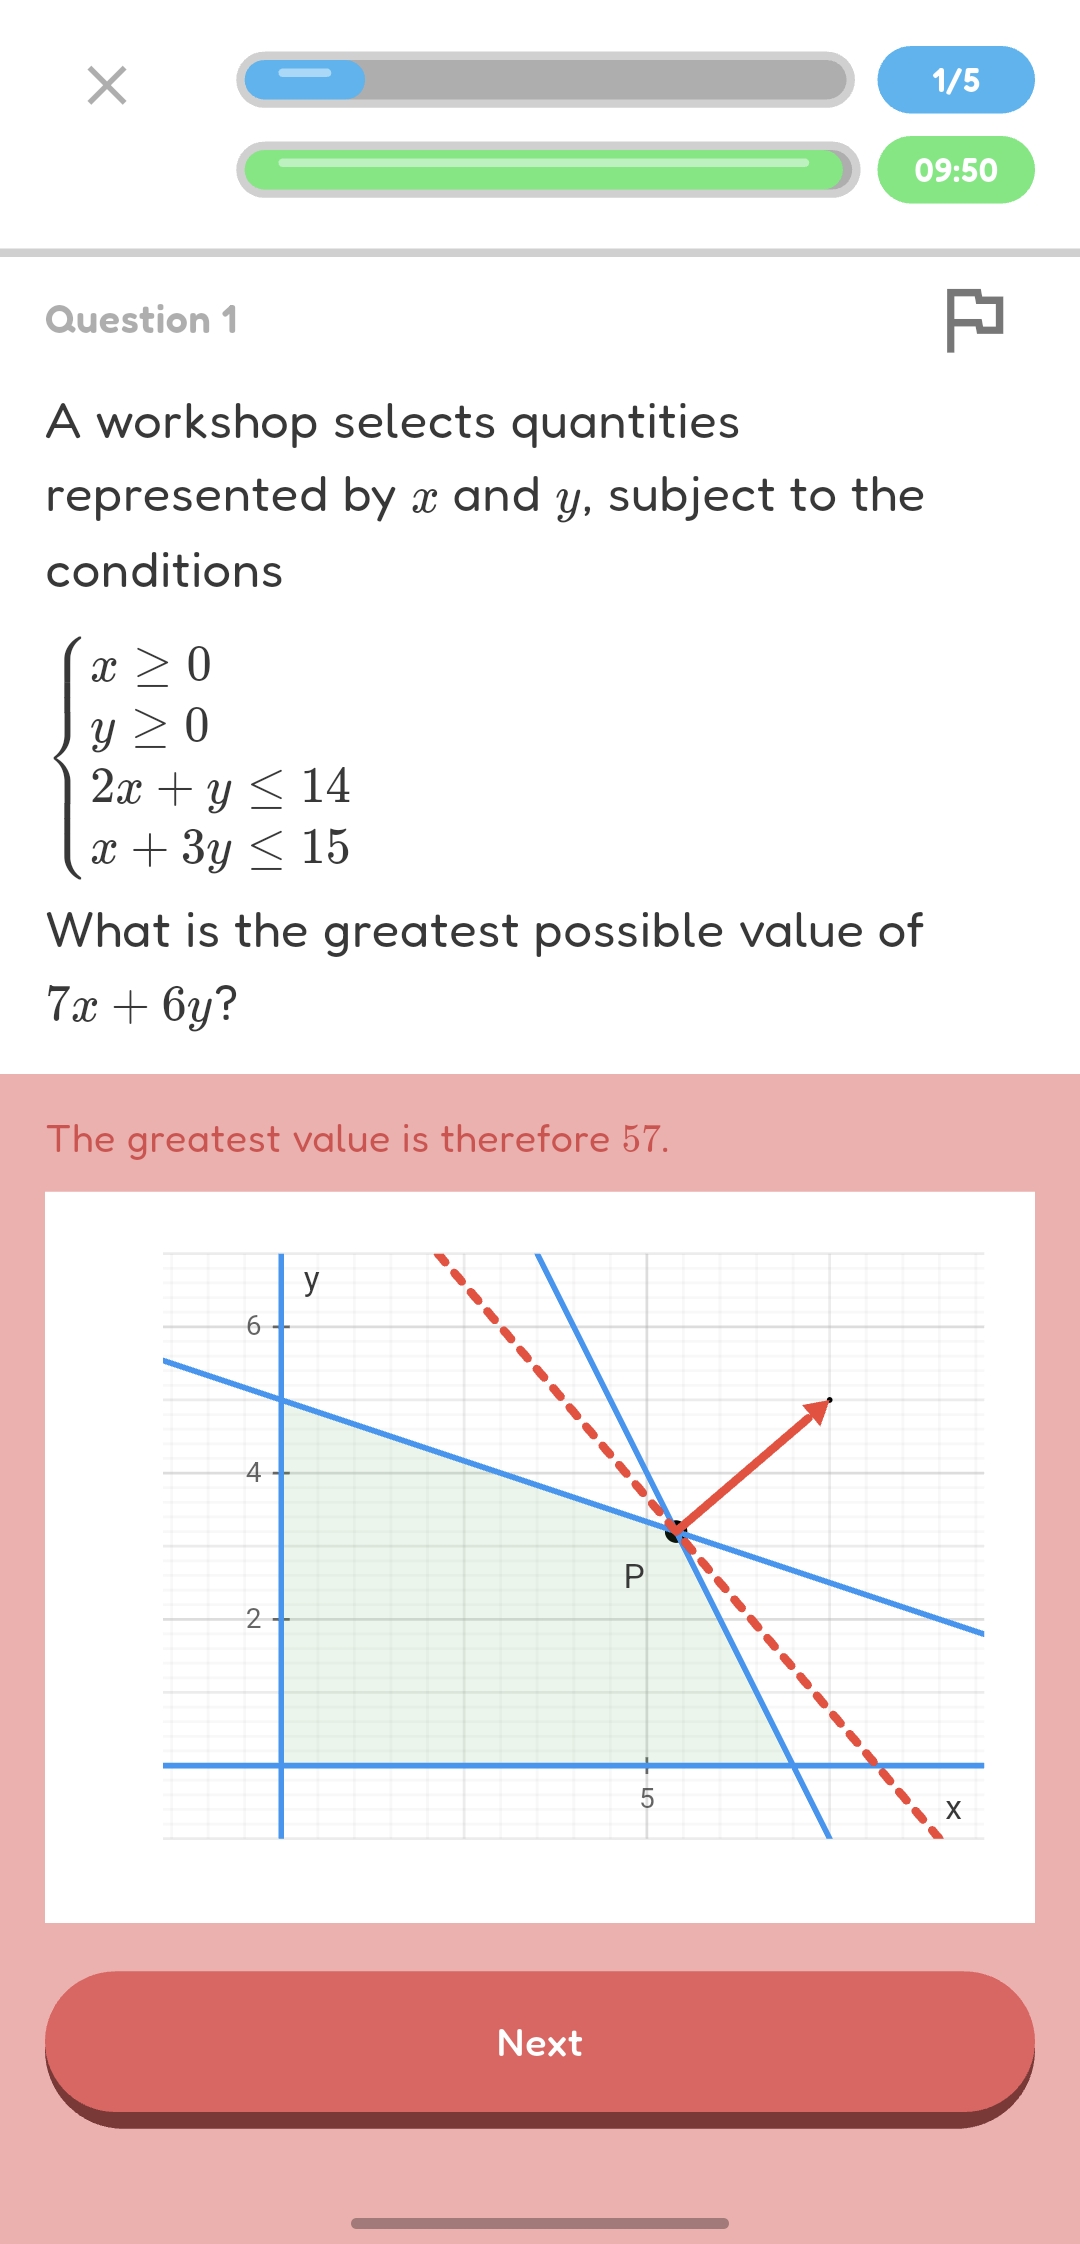
Generates function graphs, lines, segments, labelled points, coordinate axes, intersections and feasible regions based on the question, clearly presenting the conditions expressed by equations and inequalities to help students understand the question, interpret graphical information and analyse the mathematical relationships involved.
Live Examples
Examples
Linear Programming Feasible Region
Function Transformation
Sine Function
Circle-Line Intersection
Quadratic Parabola
Logarithmic Function Comparison
△
2D Geometry Diagrams
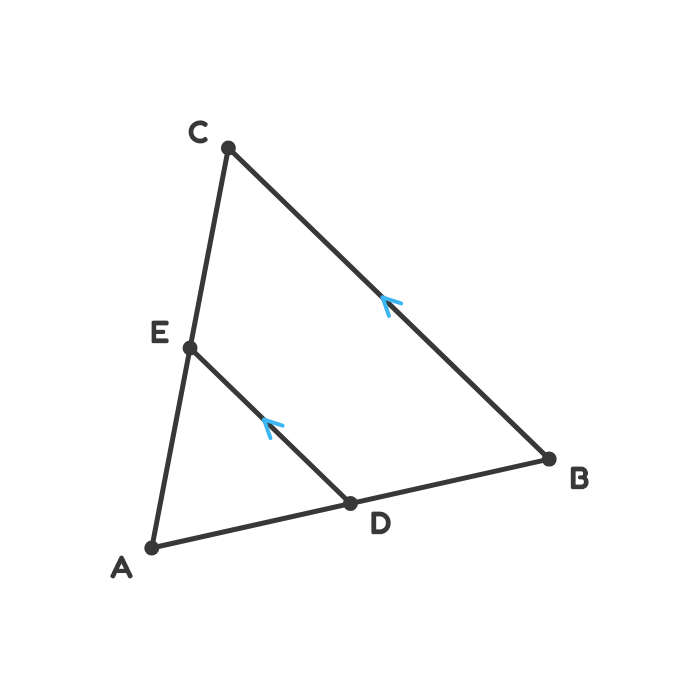
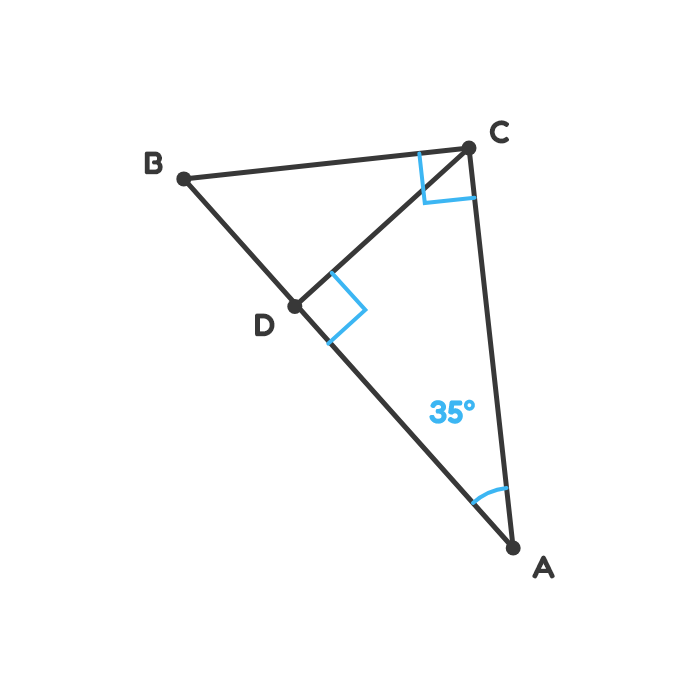
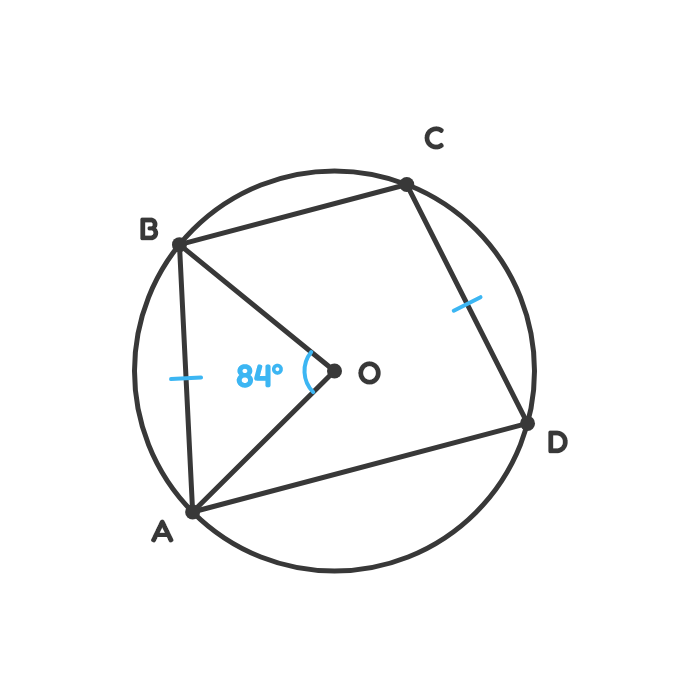
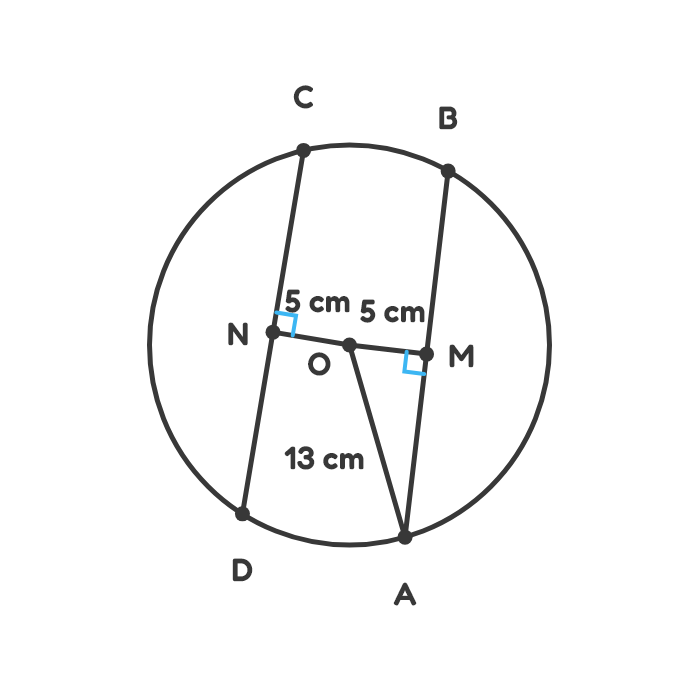
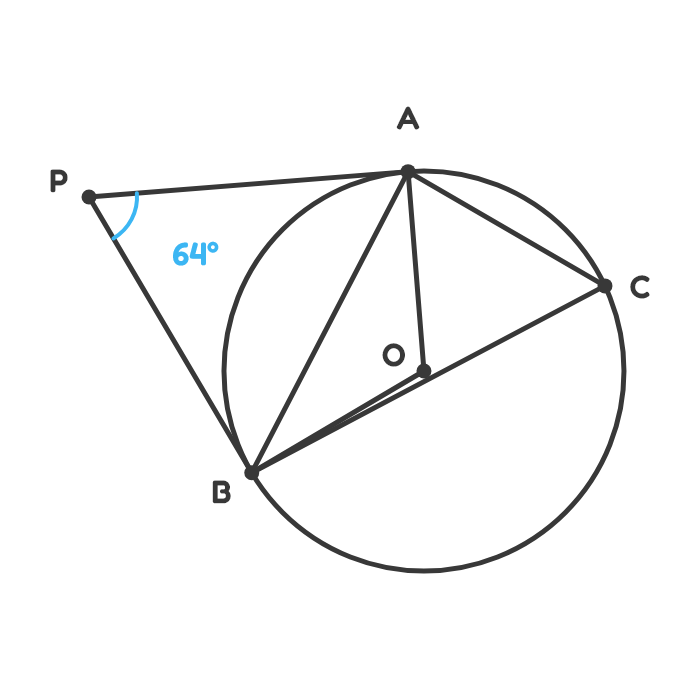
Generates diagrams for secondary and HKDSE-style geometry questions, including similar triangles, circles, tangents, chords, angle marks, and construction lines.
Live Examples
Examples
Parallel Lines and Similar Triangles
Altitude in a Right Triangle
Equal Chords and Circle Angles
Chords Equidistant from the Centre
Two Tangents and Central Angles
🔷
3D Shapes
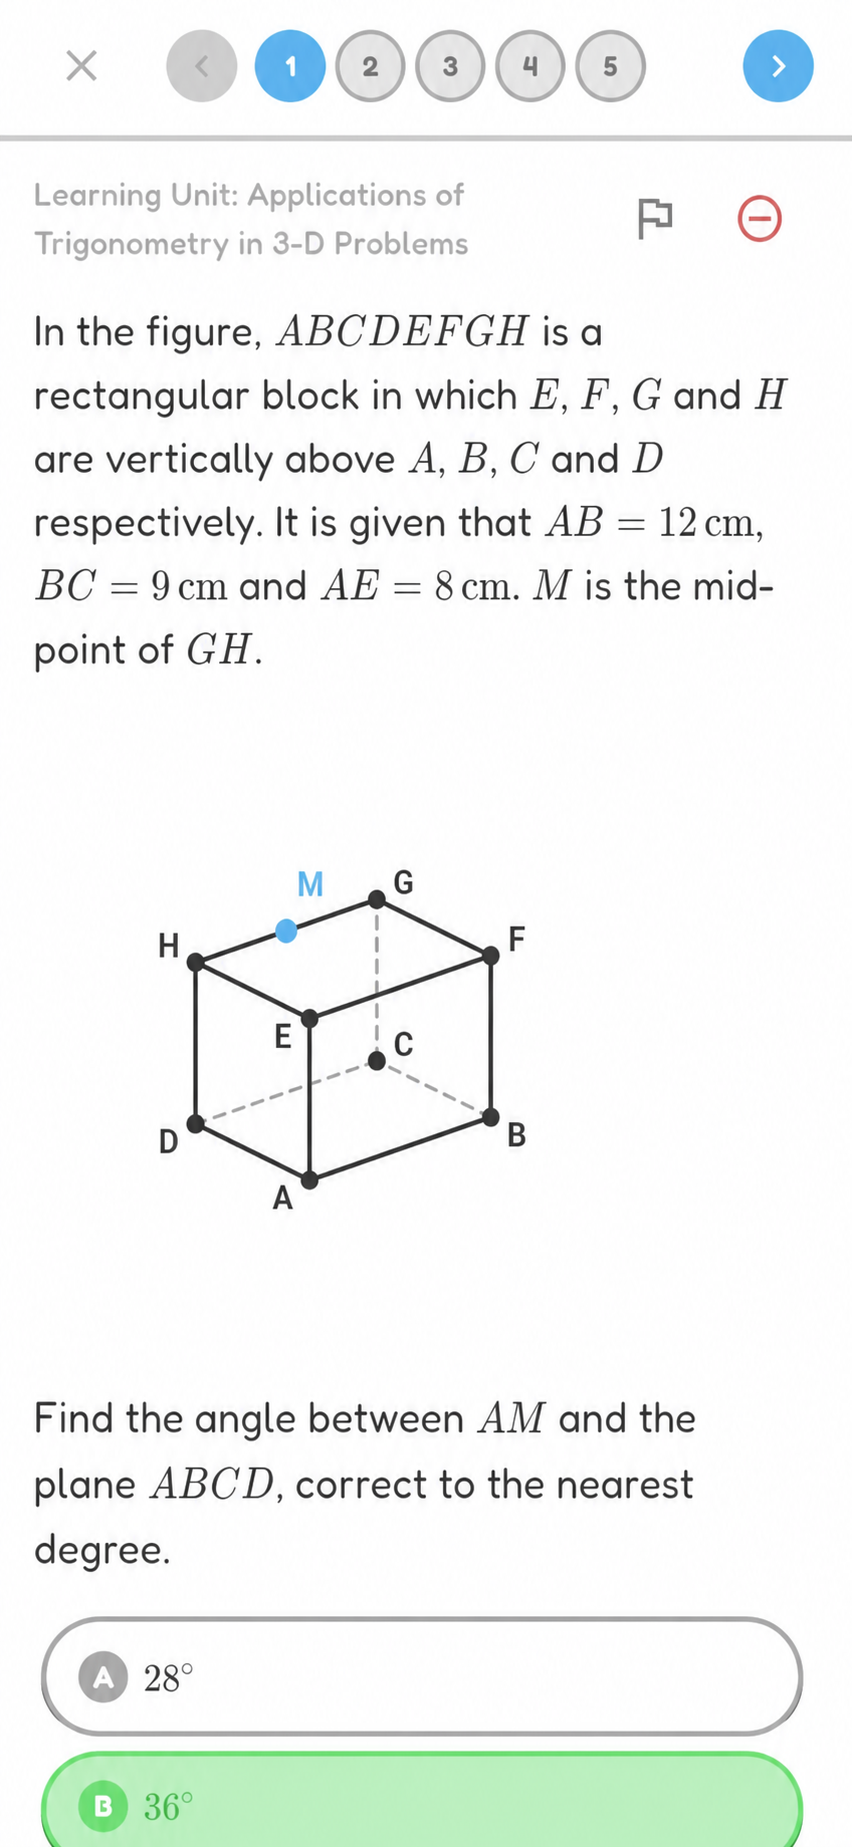
Visualises vertices, hidden edges, reference points, internal lines and highlighted planes in clear solid models, helping students reason about spatial relationships and solve 3-D trigonometry problems.
Live Examples
Examples
Cube with a Diagonal Cross-sectionCuboid with a Point on an EdgeTriangular Prism with a Midpoint LineSquare Pyramid with Highlighted Planes
📈
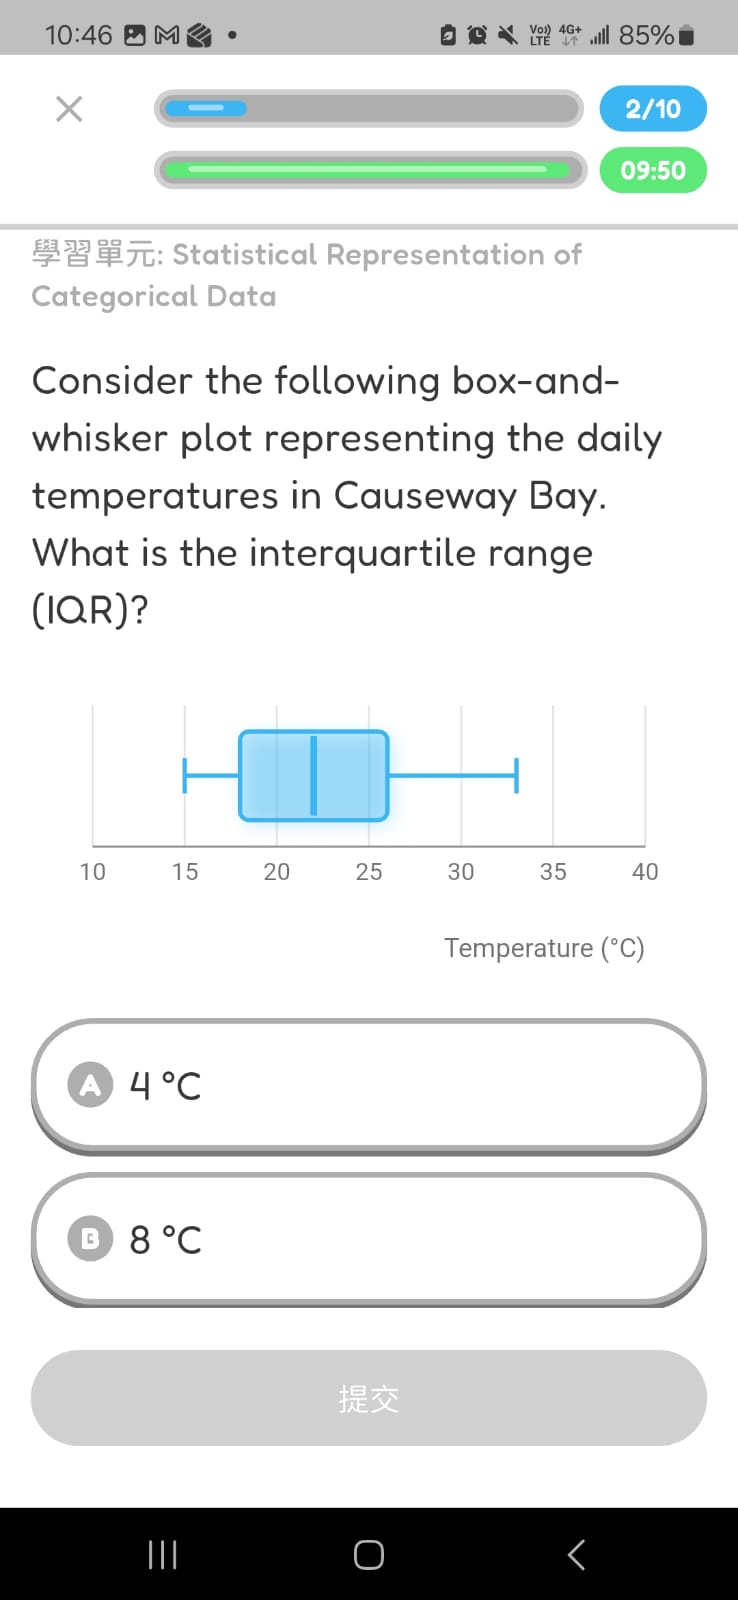
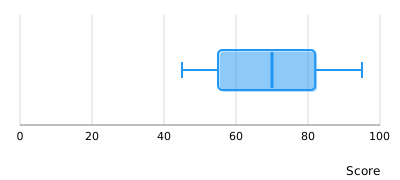
Box Whisker Plot
Statistical box-and-whisker plot showing five-number summary: smallest, Q1, median, Q3, and largest values.
Live Examples
Examples
Score Distribution Example
📊
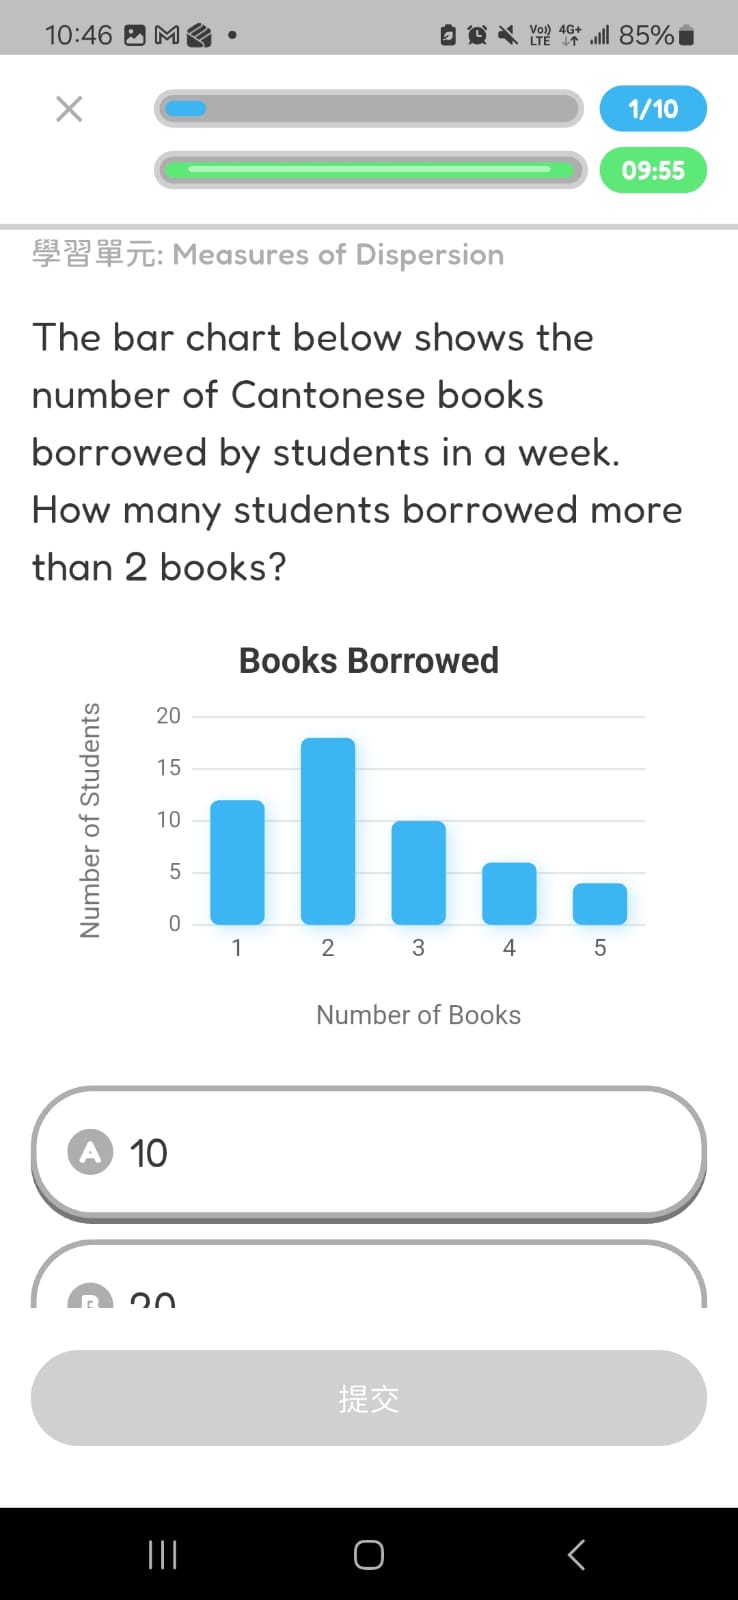
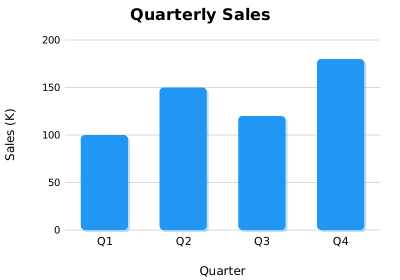
Bar Chart
Vertical bar chart with configurable axes, labels, and values. Perfect for data interpretation questions.
Live Examples
Examples
Quarterly Sales Example
📊
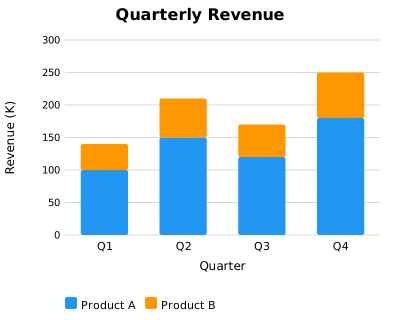
Stacked Bar Chart
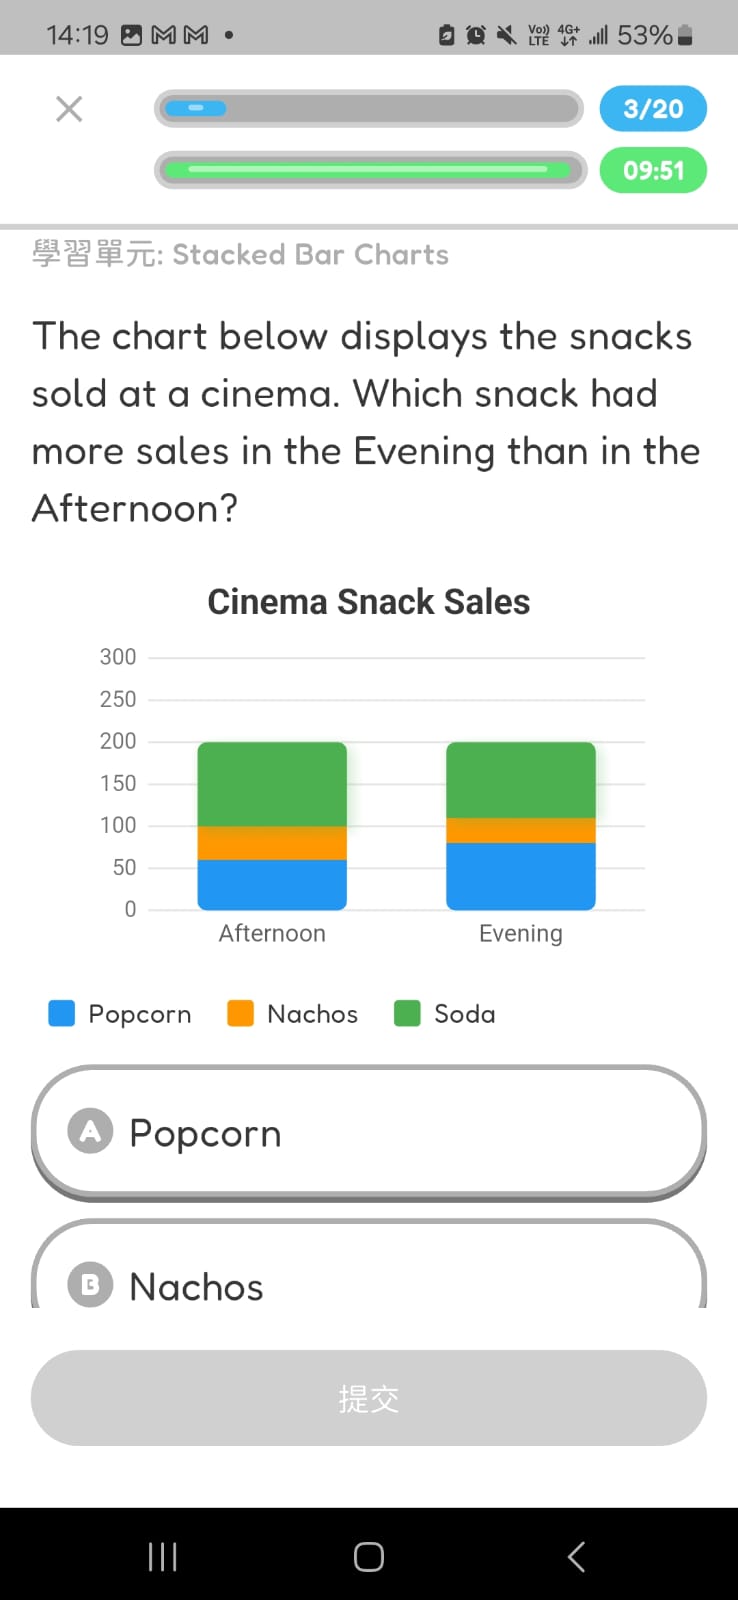
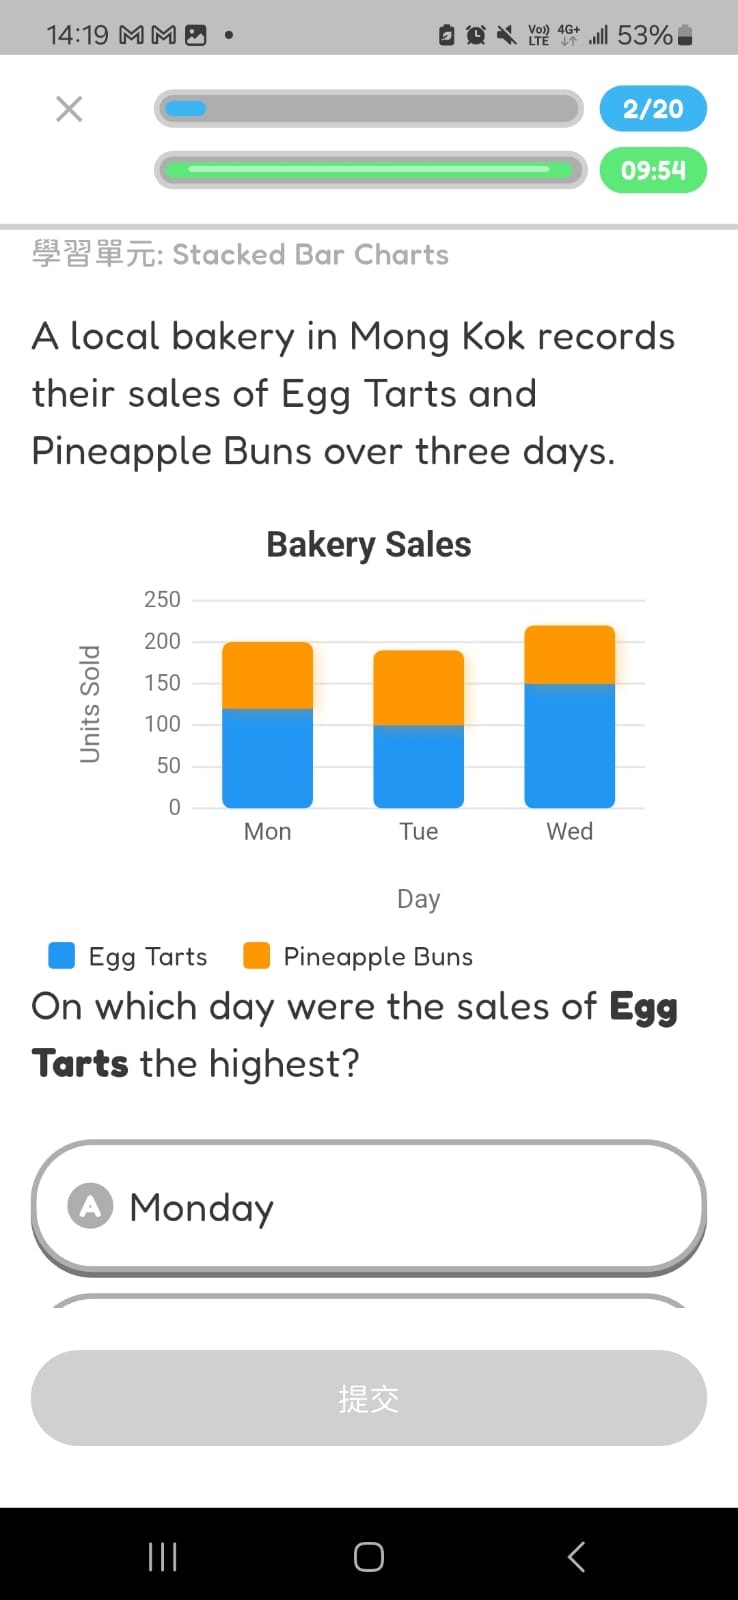
Vertical stacked bar chart with multiple data series. Supports up to 4 series with automatic color assignment and legend.
Live Examples
Examples
Quarterly Revenue by Product
📉
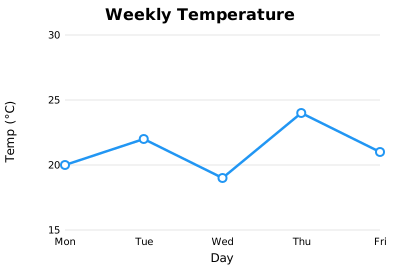
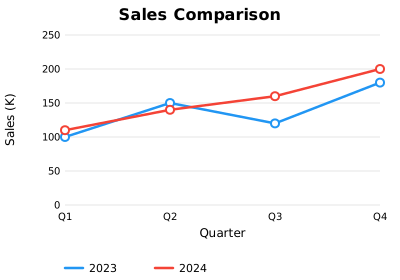
Broken Line Graph
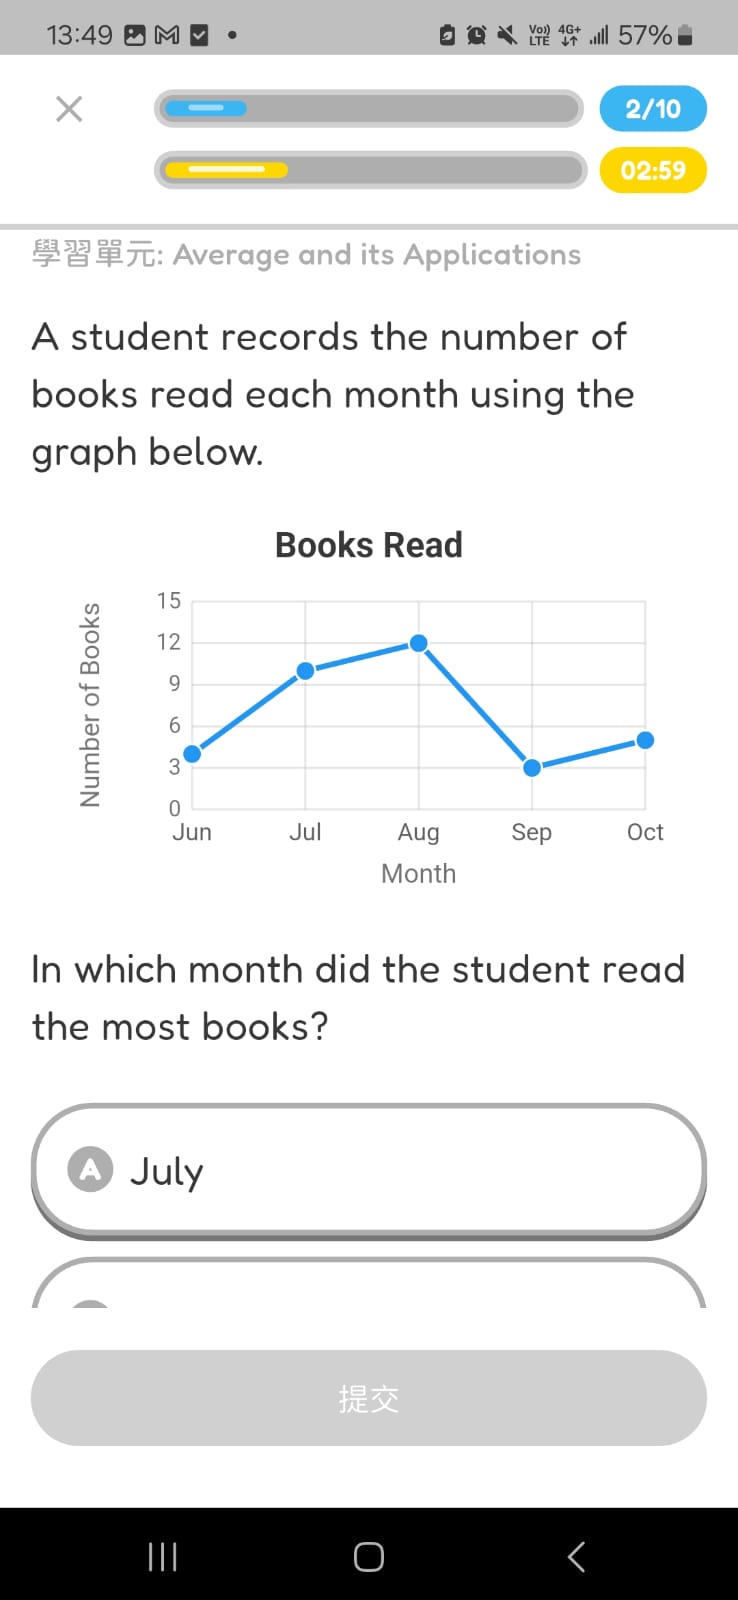
Line chart where data points are connected by straight line segments. Supports multiple series with different colors for trend comparison.